The Seagull Nebula (IC 2177): Unveiling Oxygen with Unlinked Stretches
26 Nov 2025
The Astrophysics of IC 2177 and NGC 2327
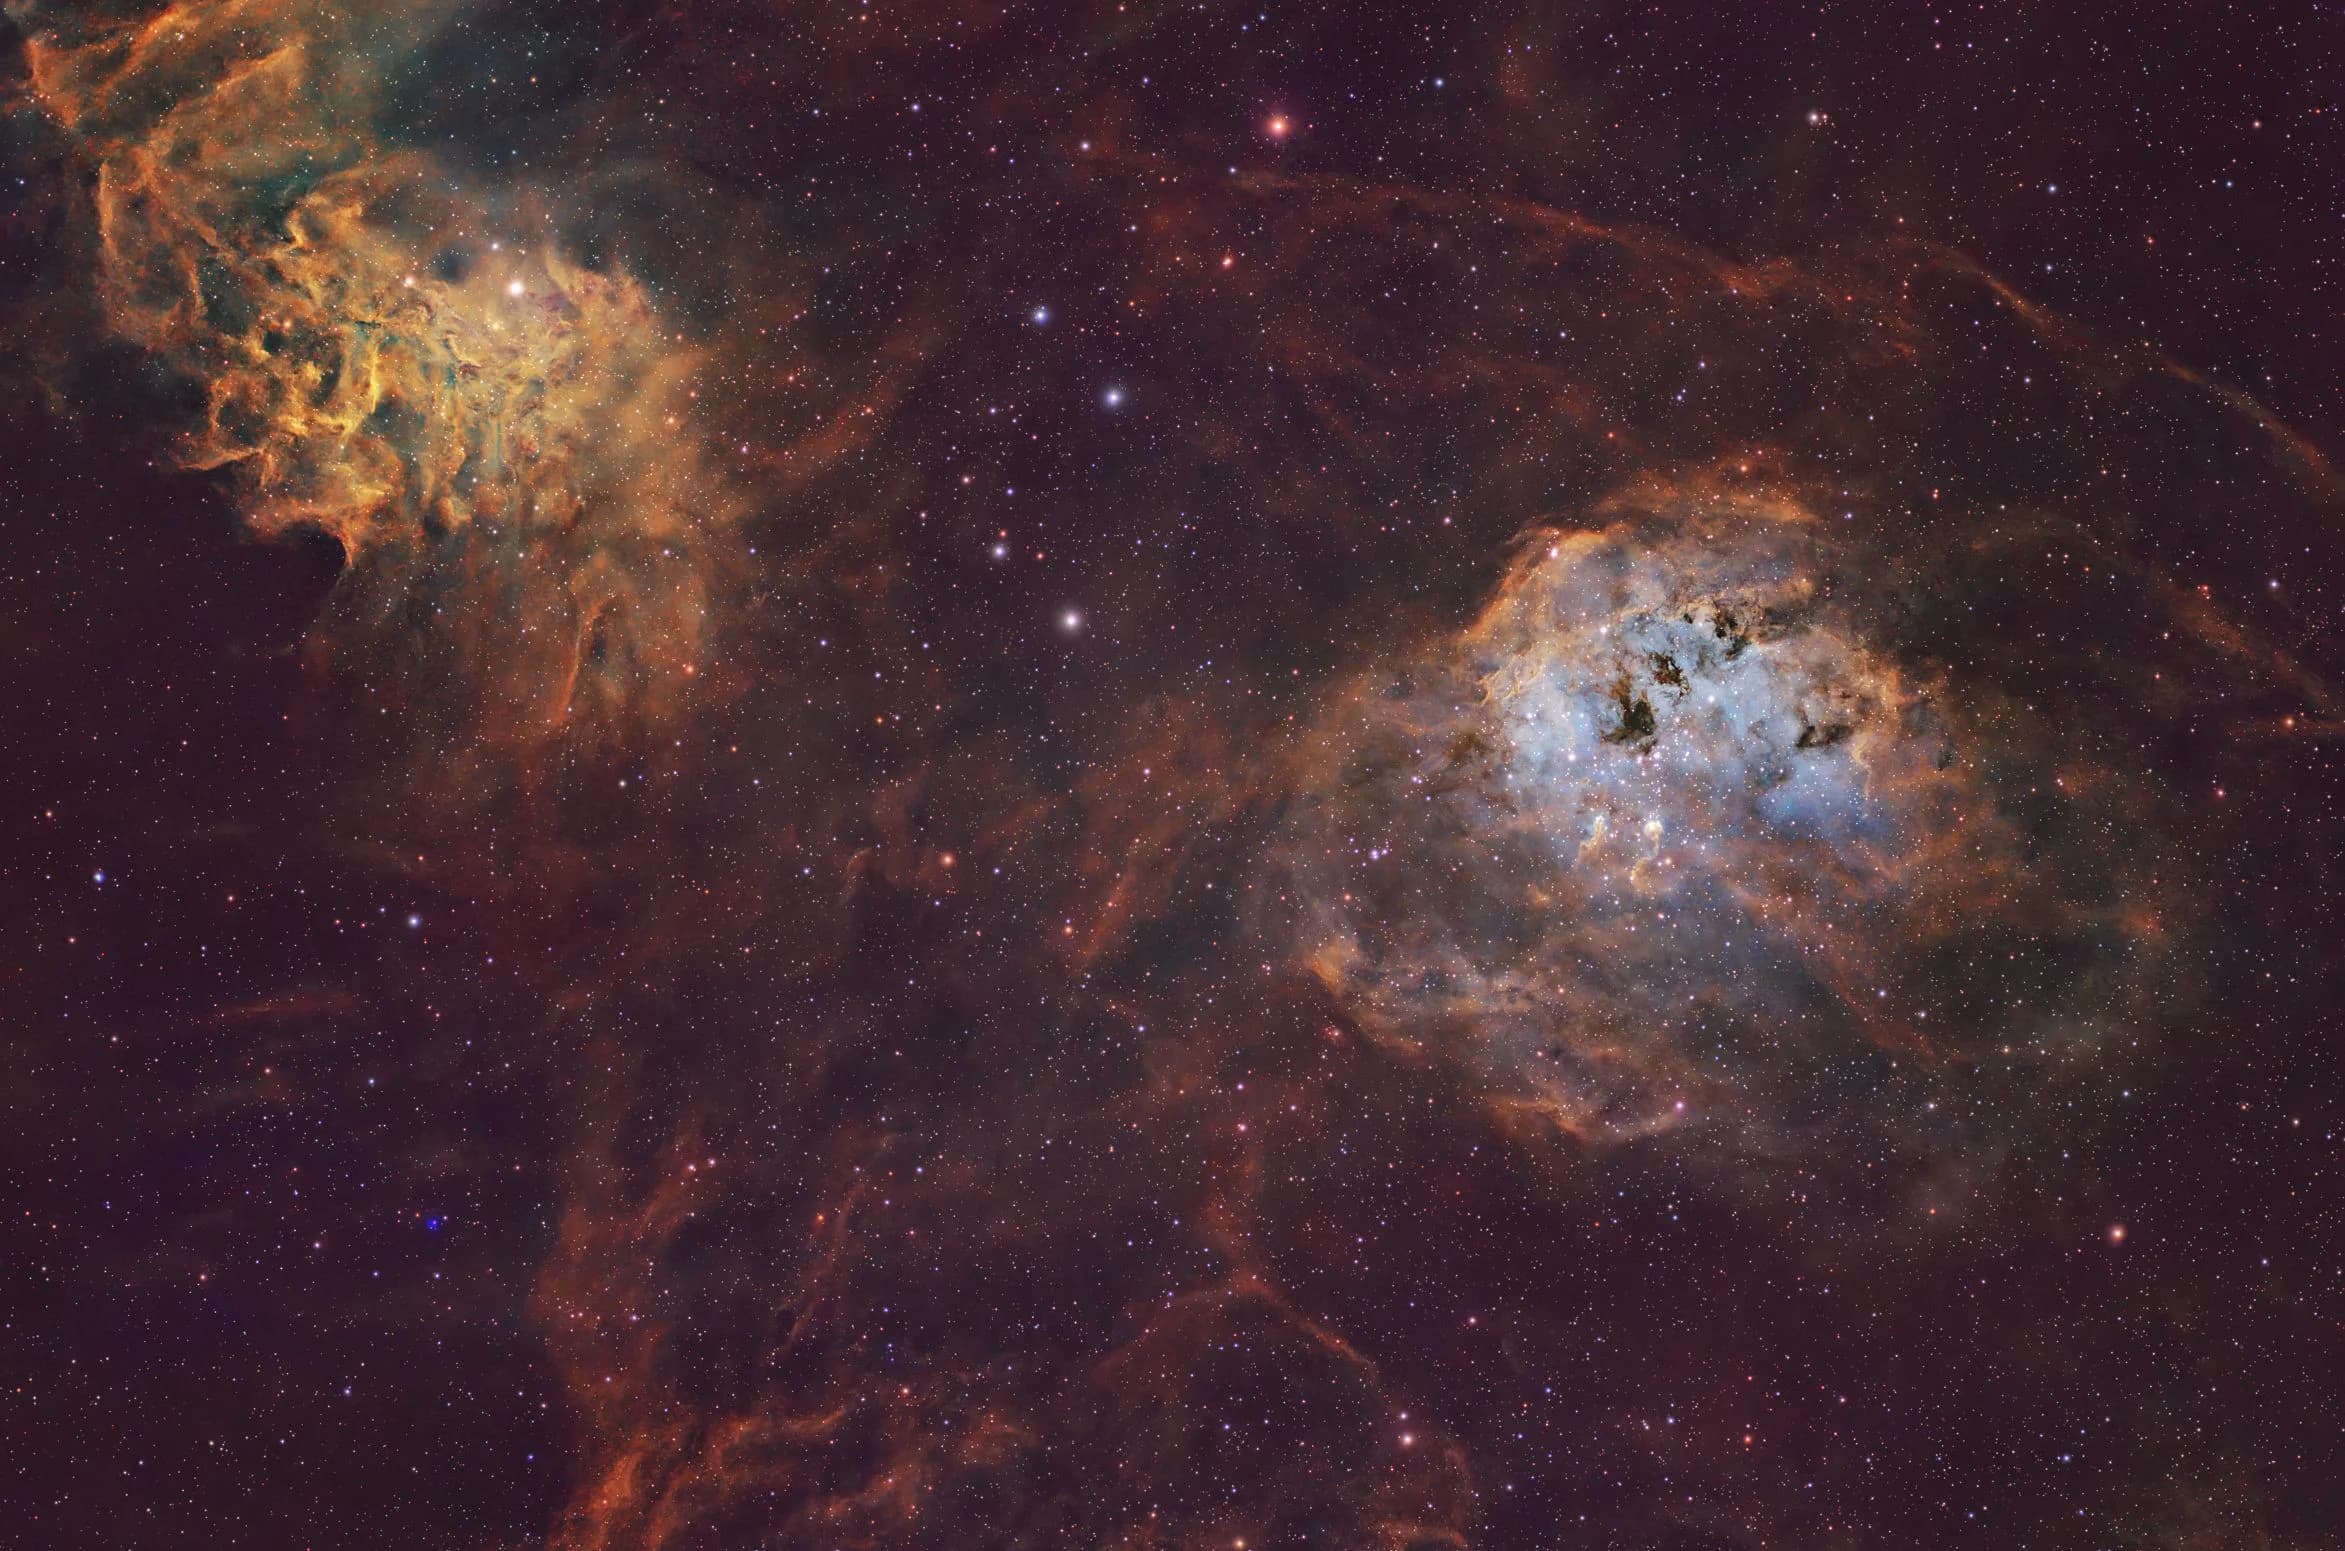
The Seagull Nebula is a massive star-forming region located approximately 3,800 light-years away on the border of the Monoceros and Canis Major constellations. The entire complex spans roughly 100 light-years across, requiring a wide-field optical train to capture it in a single frame. For this project, the William Optics 71GT APO paired with the ASI294MC Pro provided the necessary field of view to frame the sprawling hydrogen gas clouds and distinct structural elements.
This region is technically a collection of several cataloged deep-sky objects. The prominent "wings" are officially designated as IC 2177 (or Sharpless 2-296), which consist of long filaments of ionized gas and cold dust lanes. The distinct, bright "head" of the bird is NGC 2327, a compact emission and reflection nebula housing an embedded star cluster. The intense ultraviolet radiation from a massive, 20-solar-mass Be-type star (HD 53367) located near the center of NGC 2327 acts as the "eye" of the seagull, exciting the surrounding hydrogen and making it glow brightly. Scattered throughout the lower wing are distinct open clusters of young stars, specifically NGC 2343 and NGC 2335, which contrast sharply against the deep narrowband emission.
The stellar field also contains highly dynamic physical interactions.

Beneath the right wing lies a distinct, bluish arc known as a bow shock. This high-contrast feature is created by the runaway star FN Canis Majoris. As this massive star travels through the interstellar medium at an unusually high speed, its powerful stellar wind plows into the surrounding gas. This collision creates a visible shockwave that heats and compresses the material, ionizing the oxygen atoms and resulting in a glowing blue arc. The resulting visual separation between the illuminated gas and the shadowing dust lanes is often referred to as a "bowstring effect."
The Illusion of Missing OIII Data
During my initial processing runs, the nebula presented as a nearly monolithic red structure. It is easy to assume this is due to a sheer lack of signal data. The Optolong L-eXtreme is a dual-band filter capturing only Hydrogen-Alpha and Oxygen-III. Without Sulfur-II data to map to the red channel, the typical color separation seen in Hubble palette images is absent.

However, the oxygen signal actually exists within the data. Over time, I realized the overwhelming red cast is not necessarily an absence of OIII. It is a consequence of how the post-processing software interprets and pushes the data. When the channels are stretched together based on the dominant signal, the faint oxygen is completely buried by the intense hydrogen emissions.
Raw Data and OSC Sensor Mechanics
Before applying heavy non-linear transformations, it helps to evaluate exactly what the sensor recorded. I processed the master integration minimally to inspect the raw signal. I applied GraXpert for background extraction and denoising, followed by star removal. I then split the linear frame into its core Red, Green, and Blue channels. To make the underlying signal visible for an honest comparison, I applied a Seti-Astro statistical stretch to bring the target median of each channel to 25%.


The grid above clearly shows where the signals reside. The Red channel contains a massive amount of clean Ha data. The Green and Blue channels, however, show a significantly higher noise floor and only faint traces of structure.
This happens because the ASI294MC Pro is a One-Shot Color (OSC) camera. It uses a Bayer matrix over the sensor to filter incoming light into red, green, and blue pixels. Because narrowband filters do not emit pure RGB light, but rather specific wavelengths (656nm for Ha and 501nm for OIII), the camera experiences signal bleeding across the channels. What the camera actually records looks closer to this:
R = a*Ha + b*OIII
G = c*Ha + d*OIII
B = e*Ha + f*OIII
The coefficients (represented by variables a through f ) are determined by the specific Bayer filter transmission curve of your exact sensor. Every sensor has slightly different values. While there are complex linear algebra matrices you can apply to perfectly isolate and extract these exact signals, I decided not to let the scientific nuances dictate the entire workflow. Astrophotography is a fine balance of science and art. Neither should overwhelm the other. For this dataset, I bypassed the complex coefficient math in favor of a practical, aesthetic approach using a Dynamic HOO palette.
Linked vs. Unlinked Stretching
The decision of how to push linear data into a non-linear state fundamentally changes the resulting image. I processed this target using two distinct stretching methodologies to compare the effects on the faint oxygen signal.
When applying a linked stretch, the software evaluates the Red, Green, and Blue channels together and applies a uniform transformation curve to maintain their initial ratios. Because the Ha signal in the red channel is vastly stronger than the OIII signal in the green and blue channels, the Ha dominates the stretch. The faint oxygen signal gets pulled to a much lesser extent and remains buried.
Applying an unlinked stretch forces the software to evaluate and stretch each channel independently based on its own median value. This aggressively pulls the faint OIII signal out of the noise floor, revealing the complex internal structures of the nebula. I plan to publish a detailed tutorial expanding on the mechanics of linked versus unlinked stretching, specifically comparing how it impacts images captured on OSC cameras versus dedicated monochrome sensors.


Correcting the Palette with Dynamic HOO PixelMath
While the unlinked stretch brings the nebula to life with distinct oxygen zones, there is a significant downside. Pushing the blue and green channels independently disrupts the overall color balance of the image. In my dataset, the aggressive stretch resulted in a background that was overwhelmingly high in blue noise.
With the background tamed, I moved to the final color combination. Instead of a straight mapping, I opted for a Dynamic HOO palette using PixelMath.
R = R
G = 0.7*B + 0.3*R
B = B
This specific blend allows the pure Ha signal to command the red channel while creating a synthesized green channel. By blending 70% of the OIII data (Blue) with 30% of the Ha data (Red) into the Green channel, we prevent it from being completely starved of signal. This deliberate mix injects just enough hydrogen structure to create beautiful golden and orange transition zones, yielding a highly dynamic and voluminous image rather than a flat, binary two-color palette.
Final Assembly and the Stellar Field
The final step involved anchoring the highly manipulated narrowband data back into a natural stellar environment. I took the 120 frames of 30-second broadband RGB data and processed them strictly to extract true-color stars. To seamlessly blend these RGB stars back over the dynamic HOO starless image without blowing out the highlights, I used a standard PixelMath screening formula:
~((~starless)*(~stars))By screening the stars in this way, the intense red and blue emissions of IC 2177 and NGC 2327 are properly contextualized against the scattered open clusters of NGC 2343 and NGC 2335.


- Integration
- 13.5 Hours (L-eXtreme: 12.5h, RGB: 1h)
- Telescope
- William Optics 71GT APO
- Camera
- ZWO ASI294MC Pro
- Mount
- iOptron CEM40
- Filters
- Optolong L-eXtreme, Broadband RGB
- Location
- Bhagalpur, India (Bortle 8)
- Guiding
- WO 50mm + ASI120MM
- Control
- ZWO ASIAIR